How to read a construction job cost report
A job cost report is four columns per line: budget, actual, remaining and percent used. Here is an example report read line by line, and what to do about what each line shows.
By the BidDig team, , 6 min read
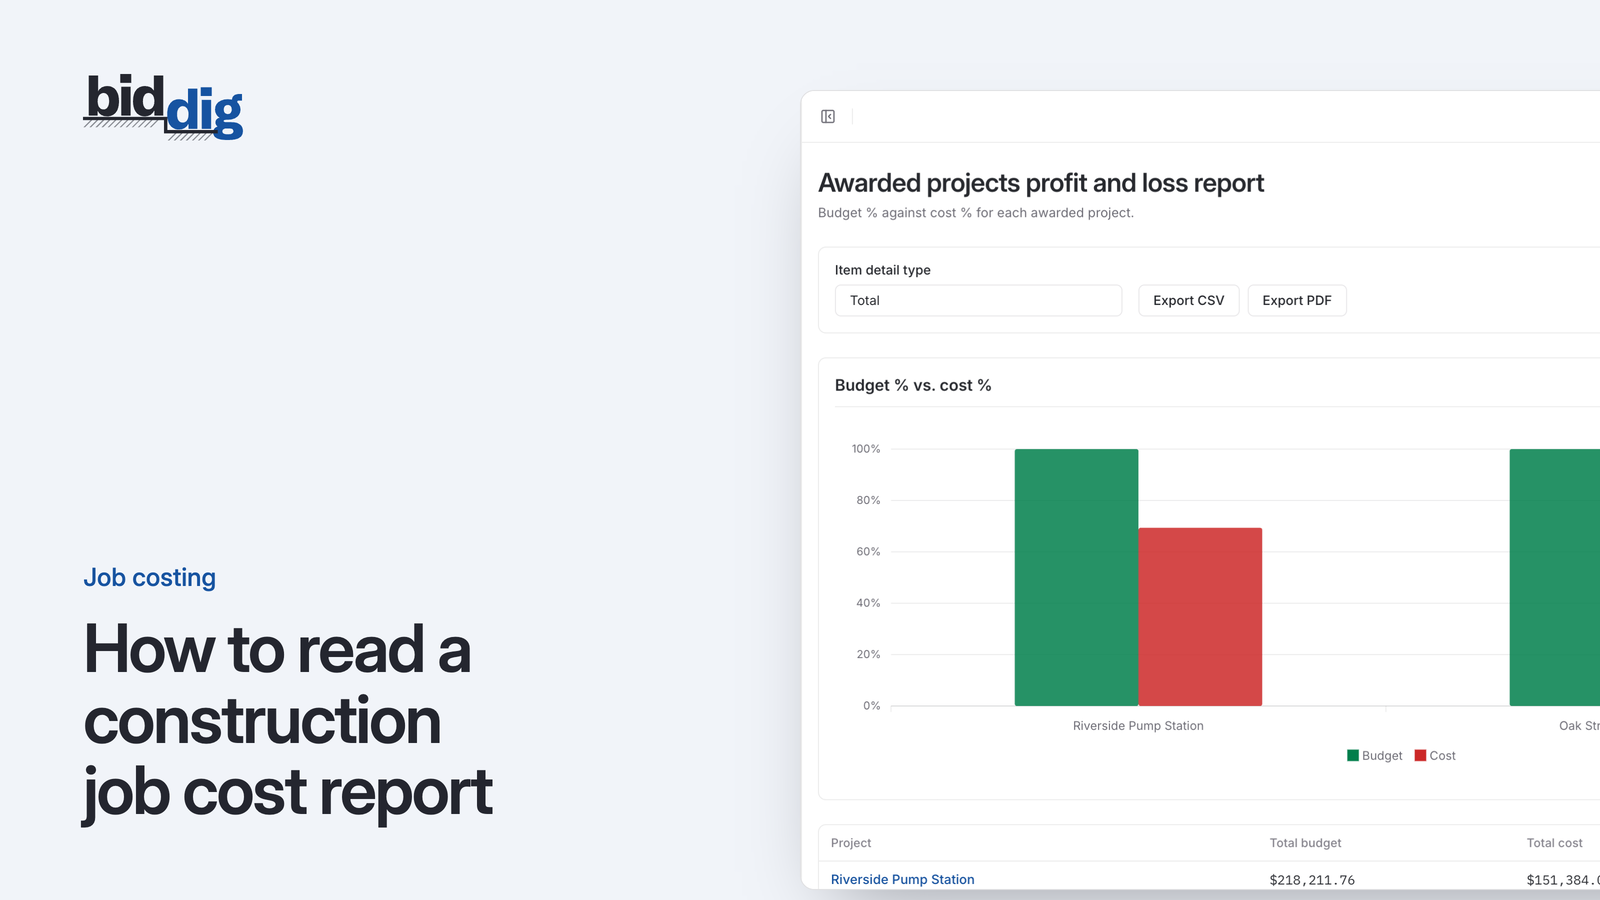
A construction job cost report lists each line item or cost type with its budget, the actual cost to date, the amount remaining and the percent of budget used. To read it, compare percent used with the percent of work in place on each line, project the final cost of any line that is spending faster than it is progressing, then check the total.
The common mistake is to read the total first, see that less than half the budget is spent, and move on. On a job in progress the total is the least reliable number on the page, because lines that have not started carry a full budget and no cost.
Example of a construction job cost report
Say a site job was bid at $200,000 of estimated cost and is under way. The figures below are made up for the example. The report by line item looks like this.
| Line item | Budget | Actual | Remaining | Percent used |
|---|---|---|---|---|
| Mobilization | $8,000 | $8,400 | -$400 | 105% |
| Clearing and grubbing | $20,000 | $17,000 | $3,000 | 85% |
| Storm pipe | $60,000 | $51,000 | $9,000 | 85% |
| Aggregate base | $40,000 | $12,000 | $28,000 | 30% |
| Paving | $72,000 | $0 | $72,000 | 0% |
| Total | $200,000 | $88,400 | $111,600 | 44% |
Layouts vary, and some reports call the lines cost codes. The four columns read the same way.
Budget
Budget is what the bid estimated the line would cost, before overhead and profit. It is not the price the customer pays for that line.
Actual
Actual is the cost recorded against the line so far. It only includes what has been entered. Hours still on paper and bills not yet coded are missing, and missing cost looks like money saved.
Remaining
Remaining is budget less actual. For storm pipe that is $60,000 less $51,000, which is $9,000. A negative figure means the line is over. Remaining is what is left of the budget, not what the rest of the work will cost.
Percent used
Percent used is actual divided by budget. For storm pipe, $51,000 divided by $60,000 is 85 percent. It says how much of the money is gone, not how much of the work is done. That second number you bring to the report yourself.
How to read a job cost report line by line
For each line, get the percent of work in place from the field and set it beside percent used. Then project the final cost: actual cost divided by the share of work done.
Mobilization, 105 percent used. The work is finished and the line is $400 over. Note the cause and move on.
Clearing and grubbing, 85 percent used. This looks close to its limit, but the superintendent says clearing is complete. The line finishes at $17,000, which is $3,000 under.
Storm pipe, 85 percent used. The same percentage, and a very different line. Say 600 LF of 1,000 LF is in the ground, which is 60 percent.
- Budget per LF: $60,000 divided by 1,000 is $60.
- Cost per LF so far: $51,000 divided by 600 is $85.
- Projected final cost: 1,000 LF at $85 is $85,000.
- Projected overrun: $85,000 less $60,000 is $25,000.
The report shows $9,000 remaining. The 400 LF still to lay will cost $34,000 at the current rate (400 at $85). This is the line to act on, and 40 percent of the work is still ahead.
Aggregate base, 30 percent used. Nothing about 30 percent draws the eye. But say only 25 percent of the base is placed. Then $12,000 divided by 0.25 gives a projected final cost of $48,000, which is $8,000 over budget. A line can be trending over long before its percent used looks high.
Paving, 0 percent used. Not started. Its $72,000 of untouched budget is most of the reason the total looks comfortable.
Total, 44 percent used. Now add the projections: $8,400 + $17,000 + $85,000 + $48,000 + $72,000 = $230,400. The job is heading $30,400 over a $200,000 budget, on a report whose bottom line says less than half the money is spent.
The projections are rough, because they assume the rest of each line costs the same per unit as the work so far. They are still closer to the truth than the remaining column.
How to read one line item by cost type
A line being over does not say why. Open the line by cost type. Here is the storm pipe line.
| Cost type | Budget | Actual | Remaining | Percent used |
|---|---|---|---|---|
| Material | $30,000 | $18,500 | $11,500 | 62% |
| Labor | $18,000 | $20,500 | -$2,500 | 114% |
| Equipment | $12,000 | $12,000 | $0 | 100% |
| Total | $60,000 | $51,000 | $9,000 | 85% |
With 60 percent of the pipe in the ground, each cost type should be near 60 percent used. Material is at 62 percent, so price and quantity are close to plan. Labor is at 114 percent and equipment at 100 percent. The crew and the machines are taking far longer per foot than the bid assumed.
That points to production, and it tells you what to do next:
- Confirm the costs belong to this line and were not booked to it by mistake.
- Ask the superintendent what is slowing the crew: rock, water, access, crew size or the wrong machine.
- If the ground differs from what was priced, or the scope has grown, price a change order before more pipe is laid.
- If it is production, change the crew or method for the remaining 400 LF.
- Write down the cause so the next bid uses a better rate.
How to read profit on a job cost report
Some reports add the contract amount and a profit column. Say this job was priced at $244,000. The planned overhead and profit is $244,000 less $200,000, which is $44,000.
Contract amount less actual cost to date is $244,000 less $88,400, or $155,600. On a job in progress that is not profit. It is the part of the price not yet consumed by cost.
Use the projected final cost instead. $244,000 less $230,400 is $13,600, against a plan of $44,000. On a completed job, with all the cost in, contract less actual cost is the real figure.
Two checks on any profit column:
- Profit before or after company overhead? Job reports usually show profit before office rent and the owner's salary, because those are not charged to jobs. See how to price overhead and profit in a construction bid.
- Margin or markup? $44,000 is 18 percent of the $244,000 price (margin) and 22 percent of the $200,000 cost (markup). See markup vs margin.
What a job cost report cannot tell you
- Progress. Cost records show what was spent, not how much work is in place.
- Costs that were not entered. A bill in someone's truck is treated as no cost.
- Unapproved extra work. With no change order, the cost is in the report and the revenue is not.
- Cash. A job can be profitable on paper while the customer has not paid.
Treat the report as the place where questions start.
How BidDig handles it
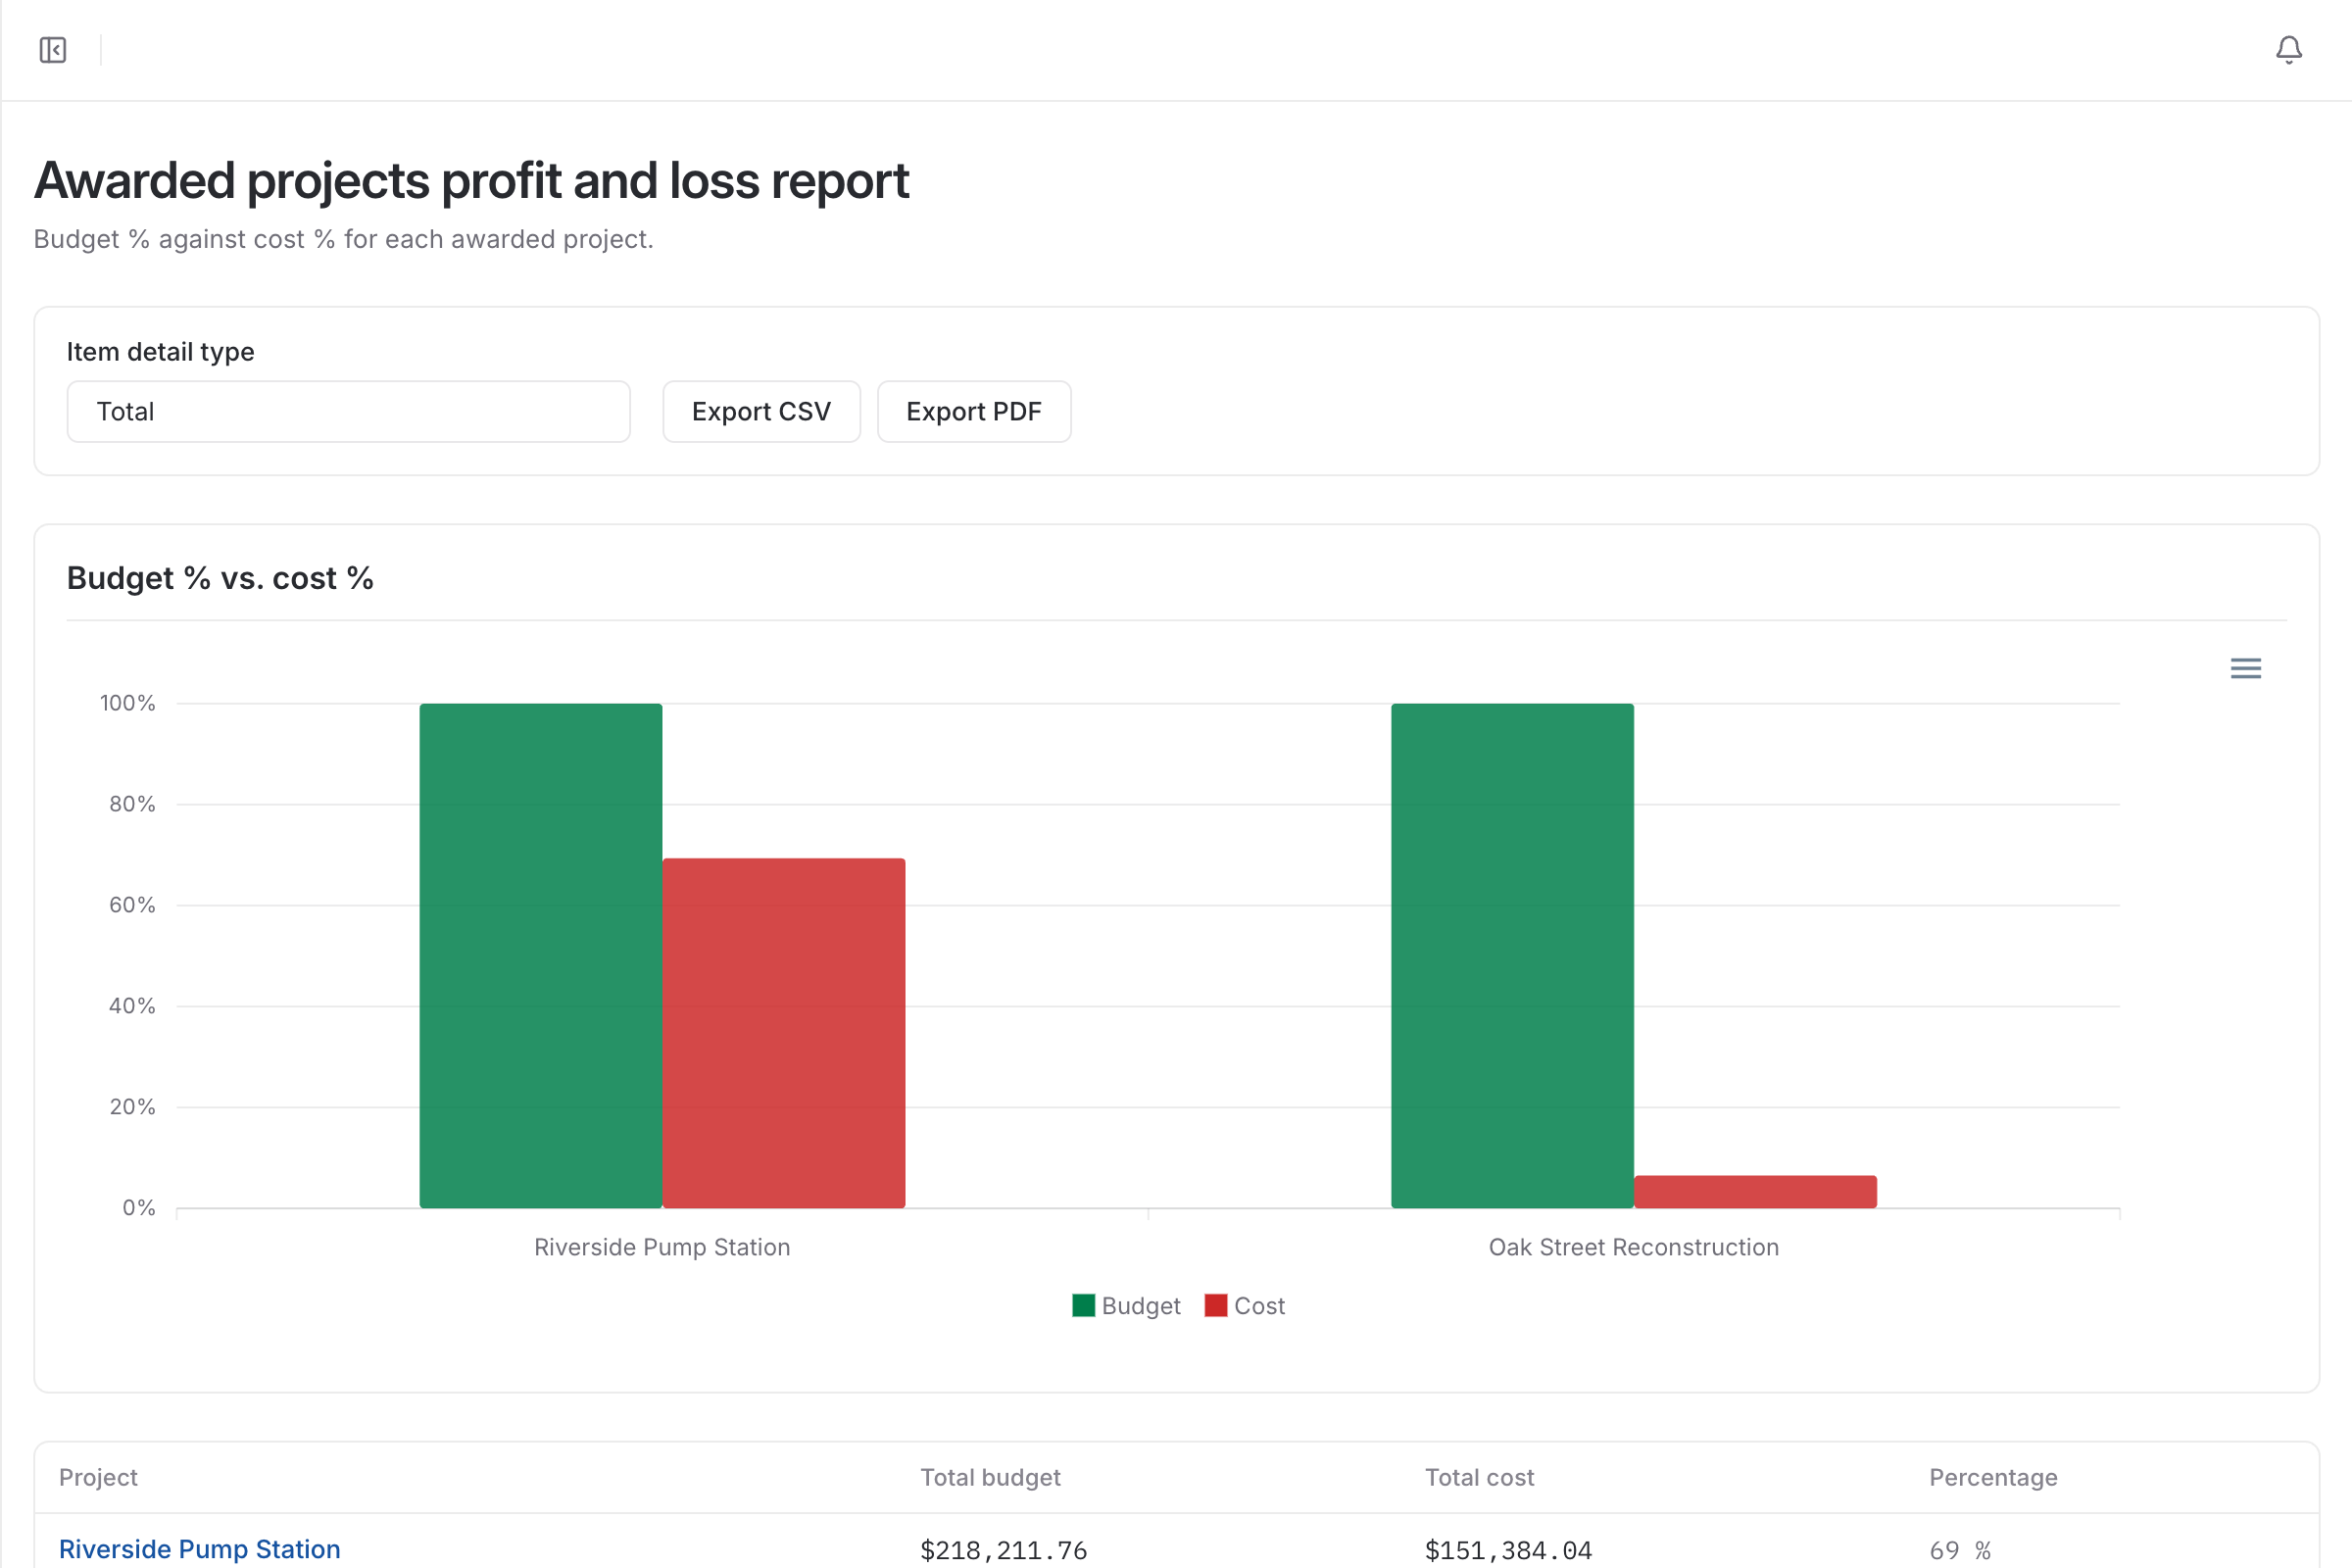
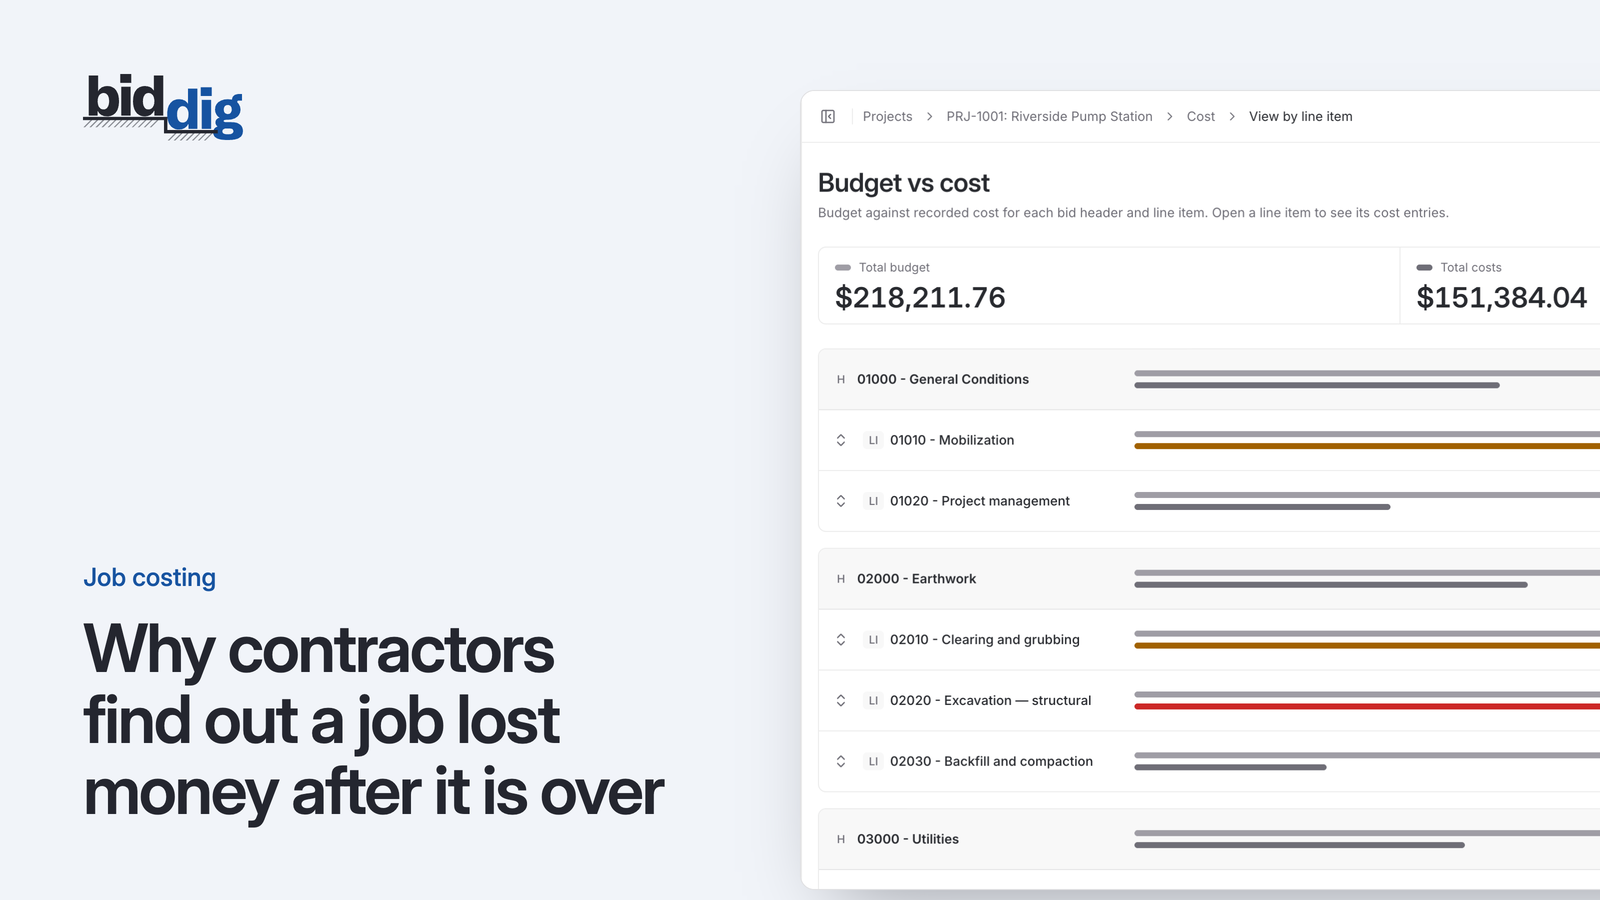
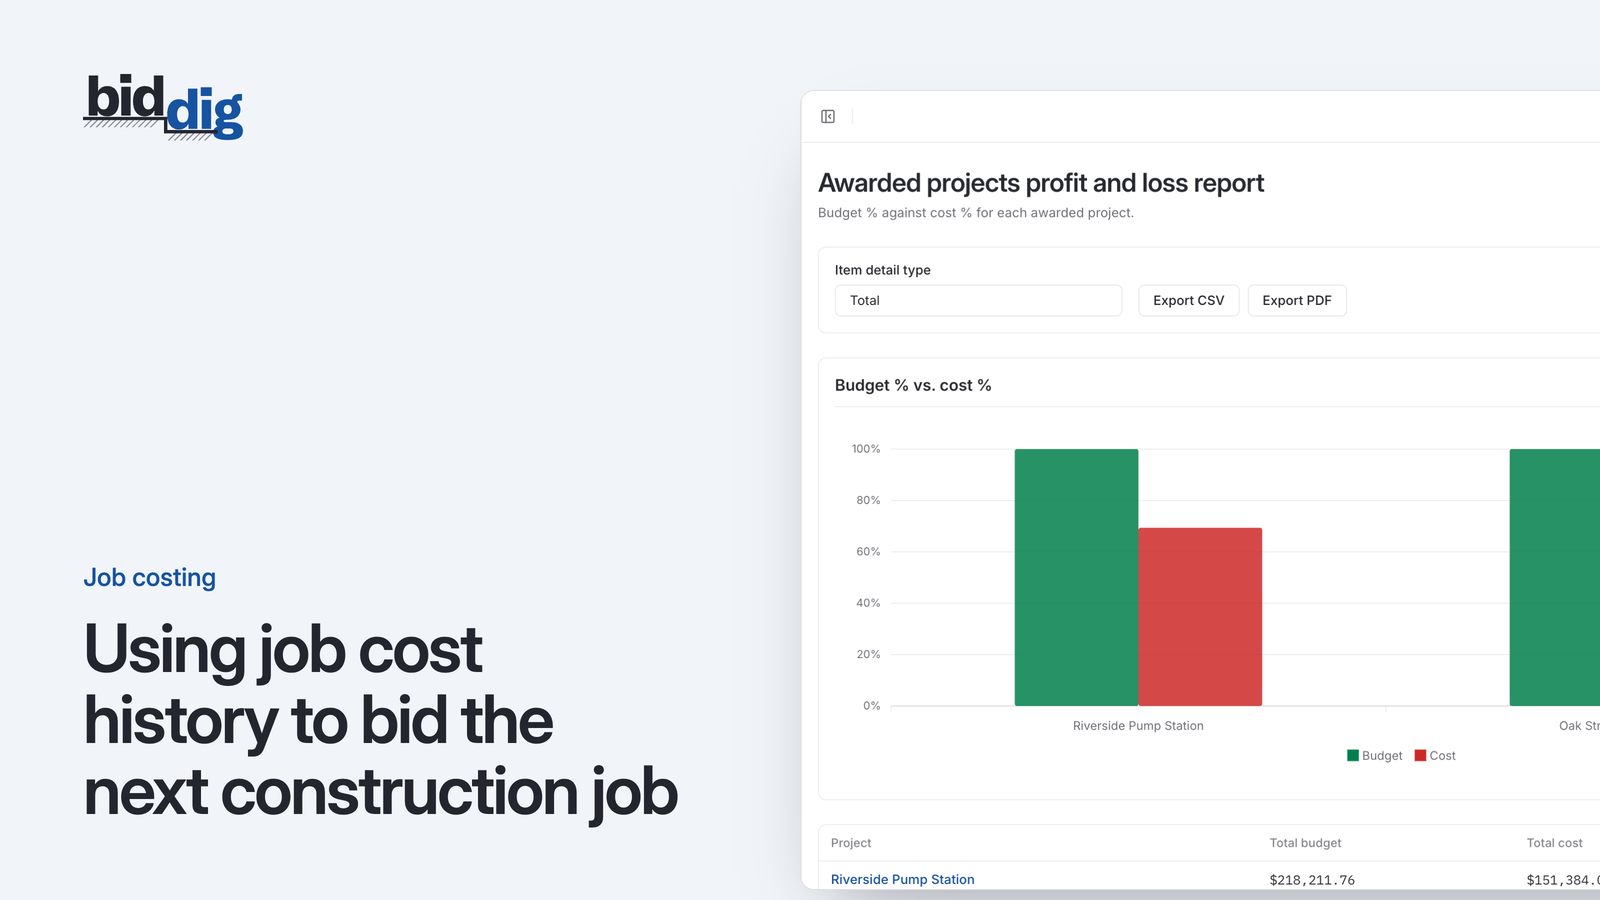
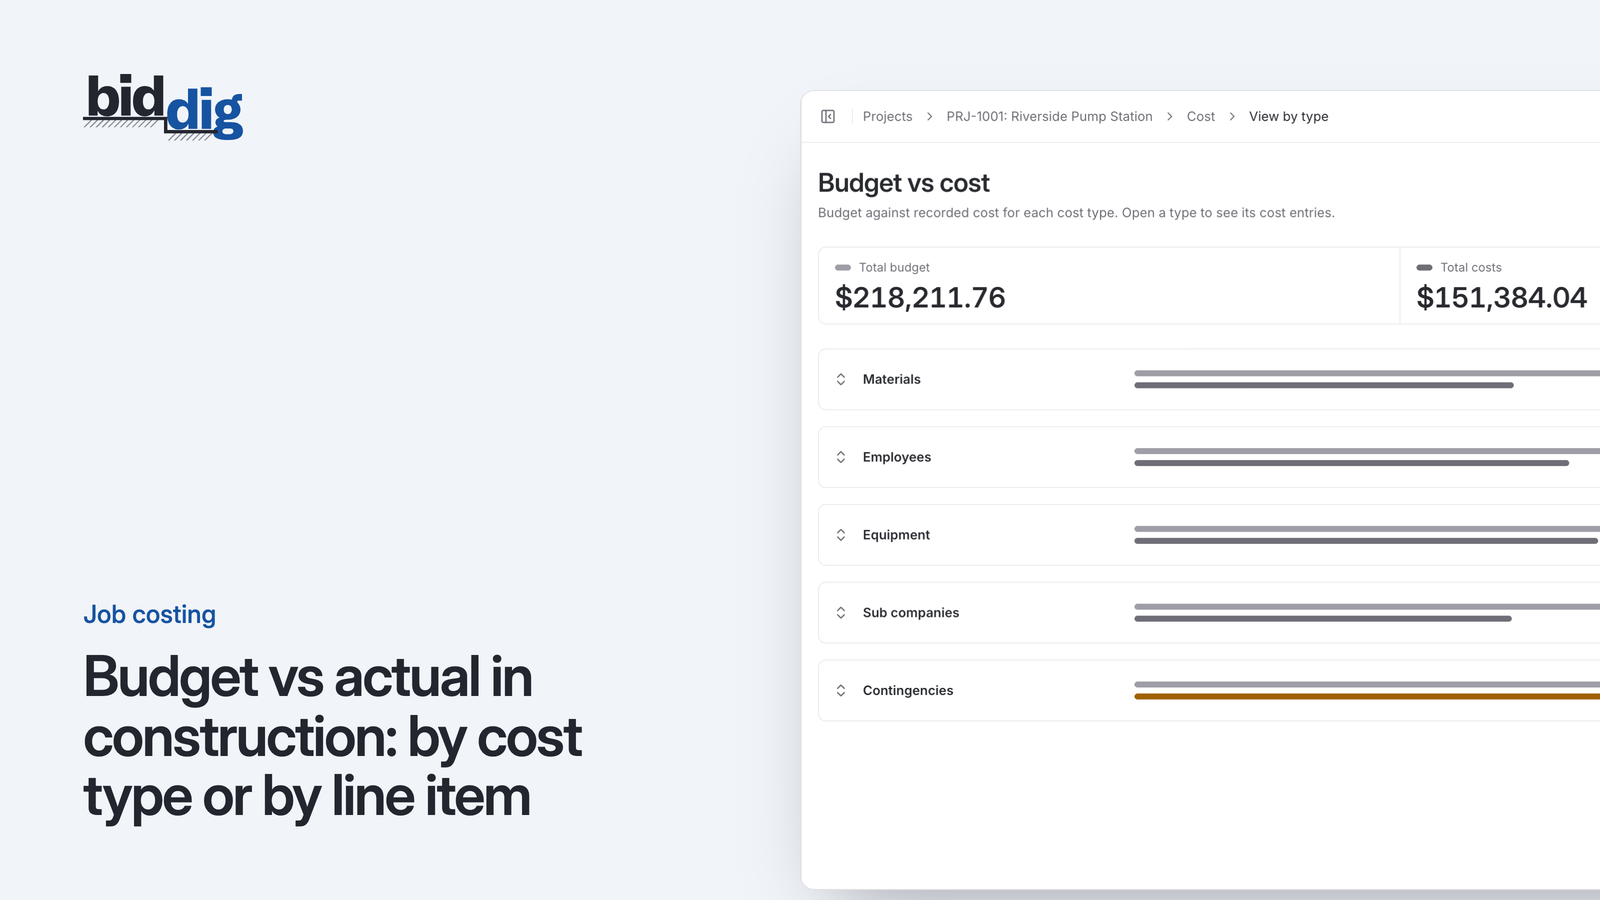
BidDig has four reports: completed projects profit and loss, awarded projects profit and loss, awarded projects progress estimate, and a single project overview. Each one exports to PDF and CSV. Job costing uses the awarded bid's line items as the budget, at estimated cost before markup, and shows budget vs actual by cost type and by line item. A line turns orange from 80 percent of budget and red above 100 percent. See reports for what each one shows. For more, read budget vs actual by cost type or by line item and the weekly job cost review. For how the pieces fit together, see construction job costing software. For the basics, read how to track job costs in construction.